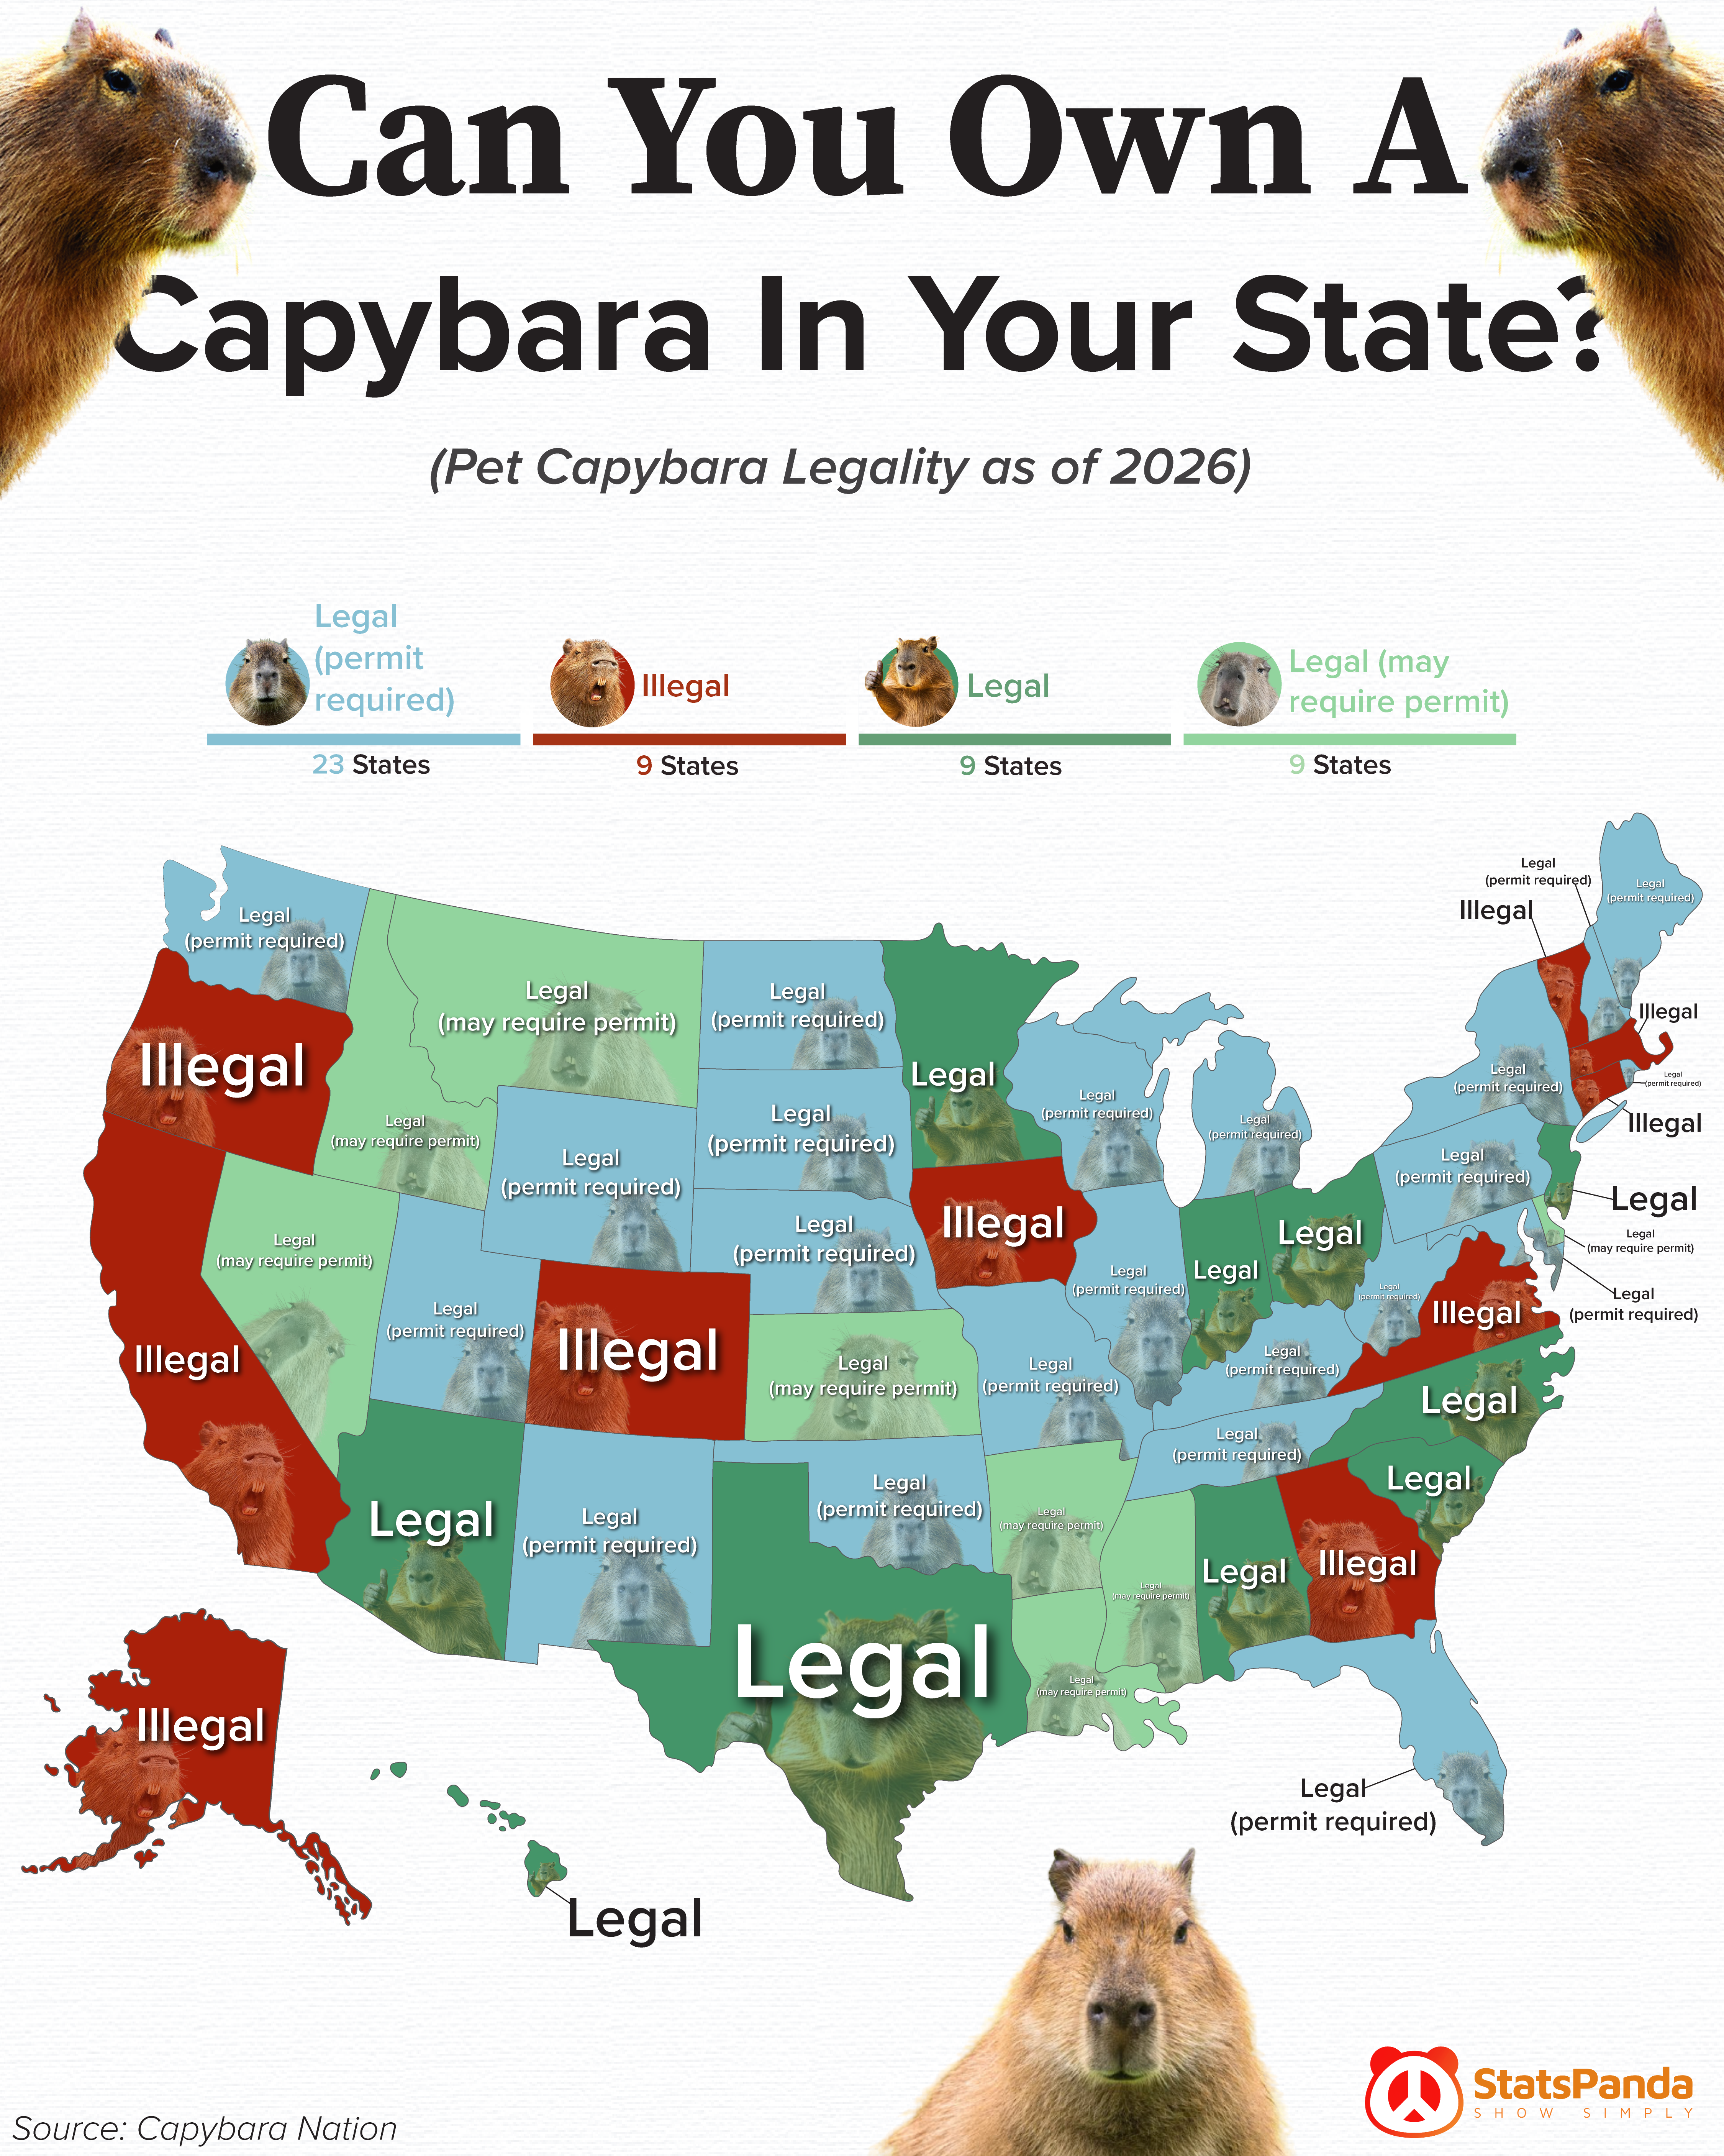
Data Stories Worth Sharing

Infographics and insights that make numbers come alive

Recent Posts

Bar chart showing fast food chains ranked by order accuracy
Bar ChartsFebruary 1, 2026

The 8 Fast Food Chains Most Likely To Get Your Order Right

Chick-fil-A leads with 95% order accuracy, while other chains struggle to hit 90%. A look at which fast food restaurants are most reliable when it comes to getting your order correct.

3 min readRead More →
Bar chart comparing Netflix pricing to other streaming and cable options
Bar ChartsFebruary 1, 2026

Netflix Is Still A Pretty Good Deal

Despite price increases, Netflix remains competitively priced compared to cable and other streaming bundles. Here's how the math works out for cord-cutters.

3 min readRead More →
Comparison chart showing Mario vs Sonic movie box office performance
Comparison ChartsFebruary 1, 2026

Mario Vs. Sonic At The Box Office

The Super Mario Bros. Movie crushed Sonic at the box office, earning over $1.3 billion globally. But Sonic's franchise is catching up. Here's how the rivalry plays out in theaters.

4 min readRead More →
Comparison chart showing MCU box office vs other major film franchises
Comparison ChartsFebruary 1, 2026

Marvel Cinematic Universe Vs. Top Film Franchises

The Marvel Cinematic Universe has grossed over $29 billion worldwide, making it the highest-grossing film franchise in history. See how it compares to Star Wars, Harry Potter, and more.

4 min readRead More →
Comparison chart showing Netflix subscribers vs other streaming platforms
Comparison ChartsFebruary 1, 2026

Netflix Subscriber Base Vs. Top Streaming Platforms

Netflix leads with 260+ million subscribers worldwide, but Disney+ and Amazon Prime Video are closing the gap. Here's how the major streaming platforms compare.

4 min readRead More →
Comparison chart showing Nike market share vs other athletic footwear brands
Comparison ChartsFebruary 1, 2026

Nike Is Still The King Of Athletic Footwear

Nike controls nearly 30% of the global athletic footwear market, more than Adidas and Puma combined. Here's how the sneaker giants stack up.

3 min readRead More →
Map showing the best rated fast food restaurant in each U.S. state
MapsFebruary 1, 2026

The Best Rated Fast Food Restaurant By State

Chick-fil-A dominates most states, but regional favorites like In-N-Out, Whataburger, and Culver's rule their home territories. See which chain each state loves most.

4 min readRead More →
Voronoi chart showing studios ranked by number of movies released
Voronoi ChartsFebruary 1, 2026

Studios That Have Released The Most Movies

Warner Bros. and Universal have each released thousands of films over their 100+ year histories. See how the major studios compare in total film output.

4 min readRead More →
Voronoi chart showing the 20 best-selling video game consoles
Voronoi ChartsFebruary 1, 2026

The 20 Best-Selling Video Game Consoles

The PlayStation 2 remains the best-selling console ever with 155 million units sold. But the Nintendo Switch is closing in fast. Here are the 20 best-selling consoles of all time.

5 min readRead More →
Voronoi chart showing the top 25 causes of death worldwide
Voronoi ChartsFebruary 1, 2026

Top 25 Causes Of Death Worldwide

Heart disease and stroke kill more people than any other causes, accounting for over 15 million deaths annually. See the full breakdown of global mortality.

5 min readRead More →
Chart showing the most watched Netflix TV shows by hours viewed
Bar ChartsJanuary 31, 2026

The Most Watched Netflix TV Shows of All Time

Squid Game leads with an unprecedented 2.2 billion hours viewed, more than double its closest competitor. Netflix's global reach has created entertainment phenomena that transcend borders.

4 min readRead More →
Bar chart showing the most valuable U.S. private companies by valuation
Bar ChartsJanuary 31, 2026

The Most Valuable U.S. Private Companies

SpaceX leads U.S. private company valuations at $180 billion, followed by Stripe and Databricks. These companies have chosen to stay private despite valuations rivaling public market giants.

4 min readRead More →
Ranking of the highest rated fast food fries in America
Bar ChartsJanuary 30, 2026

Highest Rated Fast Food Fries in America

In-N-Out leads the fry rankings with a 3.86 rating, followed by Shake Shack at 3.7. The data reveals surprising gaps between regional favorites and national chains.

4 min readRead More →
Comparison chart showing egg prices vs other food price increases since 2021
Comparison ChartsJanuary 30, 2026

No Food In The U.S. Has Surged More Than Eggs Since 2021

Egg prices have surged over 100% since 2021, far outpacing all other food categories. Bird flu outbreaks and supply chain issues have made eggs the most inflated grocery item in America.

3 min readRead More →
Chart showing the most expensive materials on Earth by price per gram
Pyramid RankingsJanuary 29, 2026

The Most Expensive Materials on Earth

Antimatter costs an astronomical $62.5 trillion per gram—more than the GDP of most countries combined. From medical isotopes to precious metals, here are the rarest materials on the planet.

5 min readRead More →
Map showing the most popular search term in each U.S. state
MapsJanuary 29, 2026

The Most Popular Search Term In Each State

From local sports teams to weather queries, each state has its own unique search obsession. Explore what Americans are typing into Google more than anything else.

4 min readRead More →
Map showing the most popular energy drink in each US state
MapsJanuary 28, 2026

The Most Popular Energy Drink in Every State

Bloom energy drink leads in 20 states, followed by Echelon in 5 states. The data reveals surprising regional preferences and the rise of wellness-focused energy drinks.

4 min readRead More →
Map showing the most subscribed YouTube channel from each U.S. state
MapsJanuary 28, 2026

The Most Subscribed YouTube Channel From Each State

From MrBeast in North Carolina to PewDiePie in... wait, he is Swedish. Discover which YouTube creators hail from each U.S. state and who has the most subscribers.

4 min readRead More →
Chart showing the highest grossing movies of all time when adjusted for inflation
Bar ChartsJanuary 27, 2026

The Highest Grossing Movies of All Time (Adjusted for Inflation)

When adjusted for inflation, Gone with the Wind leads with $4.34 billion—not Avatar. Historical ticket prices reveal a different picture of box office dominance than raw numbers suggest.

5 min readRead More →
Map showing the weirdest legal pet in each U.S. state
MapsJanuary 27, 2026

The Weirdest Pet You Can Own By State

Kangaroos in Wisconsin? Tigers in Texas? Pet ownership laws vary dramatically across the U.S. Discover the most unusual animals you can legally own in each state.

5 min readRead More →
Pyramid ranking of the most powerful passports in 2025
Pyramid RankingsJanuary 26, 2026

Most Powerful Passports In 2025

Singapore and Japan top the 2025 passport power rankings with visa-free access to 195 destinations. See how global mobility varies dramatically by nationality.

4 min readRead More →
Pyramid ranking of the least powerful passports in 2025
Pyramid RankingsJanuary 25, 2026

Least Powerful Passports In 2025

While some passports open 195 doors, others open fewer than 30. Afghanistan ranks last with visa-free access to just 26 destinations. The passport gap reflects global inequality.

4 min readRead More →
Voronoi chart showing the best-selling car brands of 2024
Voronoi ChartsJanuary 24, 2026

The Best-Selling Car Brands of 2024

Toyota sold over 10 million vehicles in 2024, maintaining its position as the world's largest automaker. See how global car sales break down by brand.

4 min readRead More →
Voronoi chart showing cumulative CO2 emissions by country
Voronoi ChartsJanuary 23, 2026

Countries That Have Contributed The Most CO2 Emissions To Date

While China leads annual emissions, the United States has contributed the most total CO2 in history. Cumulative emissions reveal who bears the greatest responsibility for climate change.

5 min readRead More →